Projects
Selected work across computer vision, machine learning and analytics.
Computer Vision
Detection, tracking and analysis of objects in images and video, from sports analytics to automated inspection.
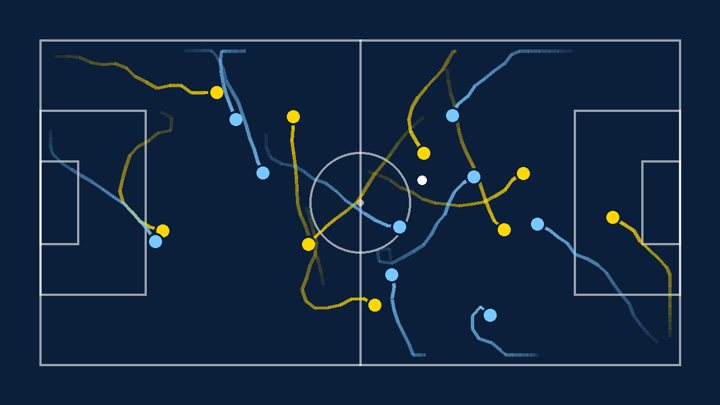
AI Football Coach
A computer-vision pipeline that watches match video, tracks every player and the ball, converts positions to real pitch metres, and turns the movement into coach-ready insight: distance and high-speed running, team shape, heat maps, passes, duels and turnovers, and written coach notes whose every number is checked against the data. The goal is an affordable tool for academies and clubs that cannot pay for international analysis platforms, working on ordinary footage. The demo analyses a 30-second clip; positions are accurate to roughly 1 m.
- ✓ Player and ball detection (YOLOv8x) Done
- ✓ Multi-object tracking (ByteTrack) Done
- ✓ Team assignment from kit colour Done
- ✓ Pitch calibration (pixels to metres) Done
- ✓ Metrics: distance, speed, heat maps, team shape Done
- ✓ Passes, duels and turnovers from ball possession Done
- ✓ Coach notes with every number checked against the data Done
- ✓ Interactive web dashboard (live demo) Done
- · Detector fine-tuned on local match footage Planned
- · Power BI report Planned
- · Full-match processing and video upload Planned
- · Swahili coach notes Planned
Maize Leaf Disease Detection
A web app where a farmer uploads a photo of a maize leaf and the model classifies it as leaf rust, leaf spot, leaf blight or healthy. It shows a confidence score for every class, then gives a recommendation and seasonal context for what to do next. Built for smallholder farming, where catching disease early protects the harvest and an agronomist is not always within reach.
Machine Learning
Predictive models for forecasting, classification and risk scoring, built to be accurate and explainable.
House Price Prediction (Kenya)
A machine-learning model, served through a Django web app, that predicts a property's price in Kenya shillings. The user picks a location, the number of bedrooms and the property type (villa or townhouse) and gets an instant estimate. Locations are encoded by their average price, and unseen locations fall back to the overall average.
Dashboards & Web Apps
Full-stack web platforms and interactive dashboards that turn raw data into something people can use every day.
Athlete Tracker
A full-stack Django platform for scouting and monitoring athlete development, from a first assessment to the next level. Coaches sign in, create teams, search for or register athletes, and record physical assessments: body measurements with automatic BMI, power and strength tests, and performance remarks calculated for them. Three workspaces keep the work organised: Scouting, Performance and Coaches.
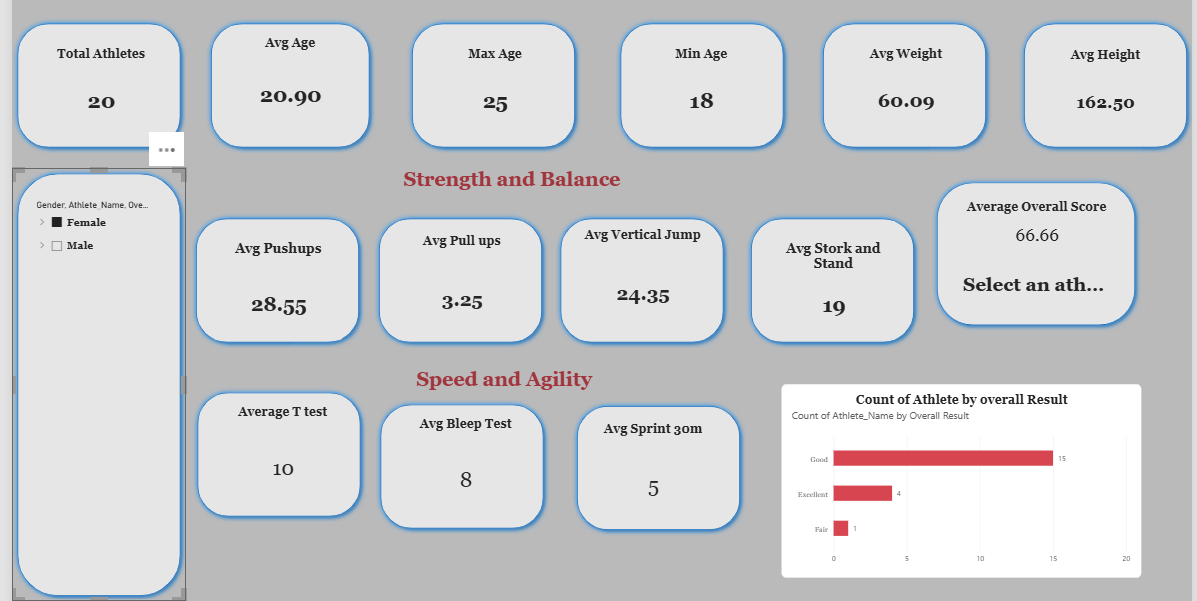
Athlete Performance Dashboard
A Power BI dashboard that summarises fitness assessments for a squad of 20 athletes. The top row profiles the group (age, weight, height). Below it, tests are grouped into Strength and Balance (push-ups, pull-ups, vertical jump, stork stand) and Speed and Agility (T-test, beep test, 30 m sprint), and a chart shows how many athletes fall into each overall result band. A gender and athlete slicer lets a coach drill down to one athlete's overall score. Athlete names are removed for privacy.